Mastering GA4 Setup & Analytics: Your Ultimate Guide
Better analytics insights = improved marketing decisions.
Gone are the days of clunky analytics. Google Analytics 4 (GA4) isn’t just a fancy upgrade from Universal Analytics (UA) – it’s a brand-new game. With its intuitive interface, smarter measurement and focus on the future, GA4 promises to help you truly understand your audience and make data-driven decisions that elevate your marketing game.
Our friendly guide is here to assist you in mastering GA4. We’ll highlight some new features and metrics GA4 has introduced, key differences compared with UA and walk through the setup process.
GA4 vs. Universal Analytics: the Key Differences
When comparing the data models of UA and GA4, it’s important to understand the differences between specific metrics:
Users Metric: GA4 introduces a trio of user metrics—total users, new users and active users, an improvement over UA’s two metrics of total users and new users.
Session Dynamics: GA4 sessions align with the session_start event, which is different from UA’s reliance on a 30-minute inactivity or reset event.
Active Users: GA4 keeps the user momentum going by not starting a new session for each campaign, unlike UA.
Event Hits: GA4 events adopt an event-based approach. The traditional Category/Action/Label hit types are all replaced with an Event hit.
With GA4 bringing a nuanced approach to engagement, let’s dig deeper into the old Bounce Rate metric we used to know too well and see how the Engagement Rate differs from the old ‘bounce or not bounce’ binary.
Decoding Bounce Rate in Google Analytics: Beyond a Simple Metric
You may have noticed that the bounce rate is missing from the GA4 Engagement Report. This is because GA4 has redefined the metrics used to measure bounce rates. Previously, bounce rates were calculated by dividing single-page sessions by all sessions in UA. However, GA4’s event-based approach introduces Engagement Rate as a more accurate method to measure user behaviour. In the GA4 context, Bounce Rate is defined as the inverse of Engagement Rate.
To calculate the bounce rate, simply subtract the engagement rate from 100%. For example, if your website has a 70% engagement rate, the corresponding bounce rate would be 30%.
GA4 Event Implementation for User Engagement Insights
GA4 Events and Parameters
GA4 events provide a comprehensive collection of data options:
Automatically Collected Events: basic events that GA4 captures by default when you set it up.
Enhanced Measurement Events: data with added functionalities under enhanced measurement, unveiling richer insights.
Recommended Events: come with defined parameters, offering advanced features tailored to your business objectives.
Custom Events: allow you to be creative and design your own actions to cater to those one-of-a-kind user behaviours.
The Potential of Recommended Events
The data model of GA4 offers great flexibility, allowing you to use different event names. However, it is advisable to implement Google’s recommended events whenever it aligns with your needs. This will enhance the understanding of your data by GA4 reports and enable them to leverage their Machine Learning capabilities.
Furthermore, Google suggests certain parameters for most of these recommended events, but you can also add any custom parameter that suits your requirements.
It is anticipated that GA4 will provide a wider range of predefined reports, which will likely include more of the recommended events. Also, GA4 emphasises that these recommended events will contribute to maximising the benefits derived from Machine Learning.
Here Is Your Step-by-step GA4 Set Up Guide
Step 1: Setting Up Your GA4 Account
To get started, head to the Admin section, name your account and customise data-sharing settings to suit your preferences for seamless integration with Google.
Step 2: Creating Your GA4 Property
Next, create a GA4 property. Input business details, configure core settings and outline your tracking objectives. GA4 will create default reports that align with each objective, streamlining your analytics experience. Bear in mind that the collection replaces the Life cycle collection when you specify business information during setup. Learn about the default reports for different business objectives here.
Step 3: Integrating Data Streams
Add a data stream in the Admin section. Activate enhanced measurement for basic event collection.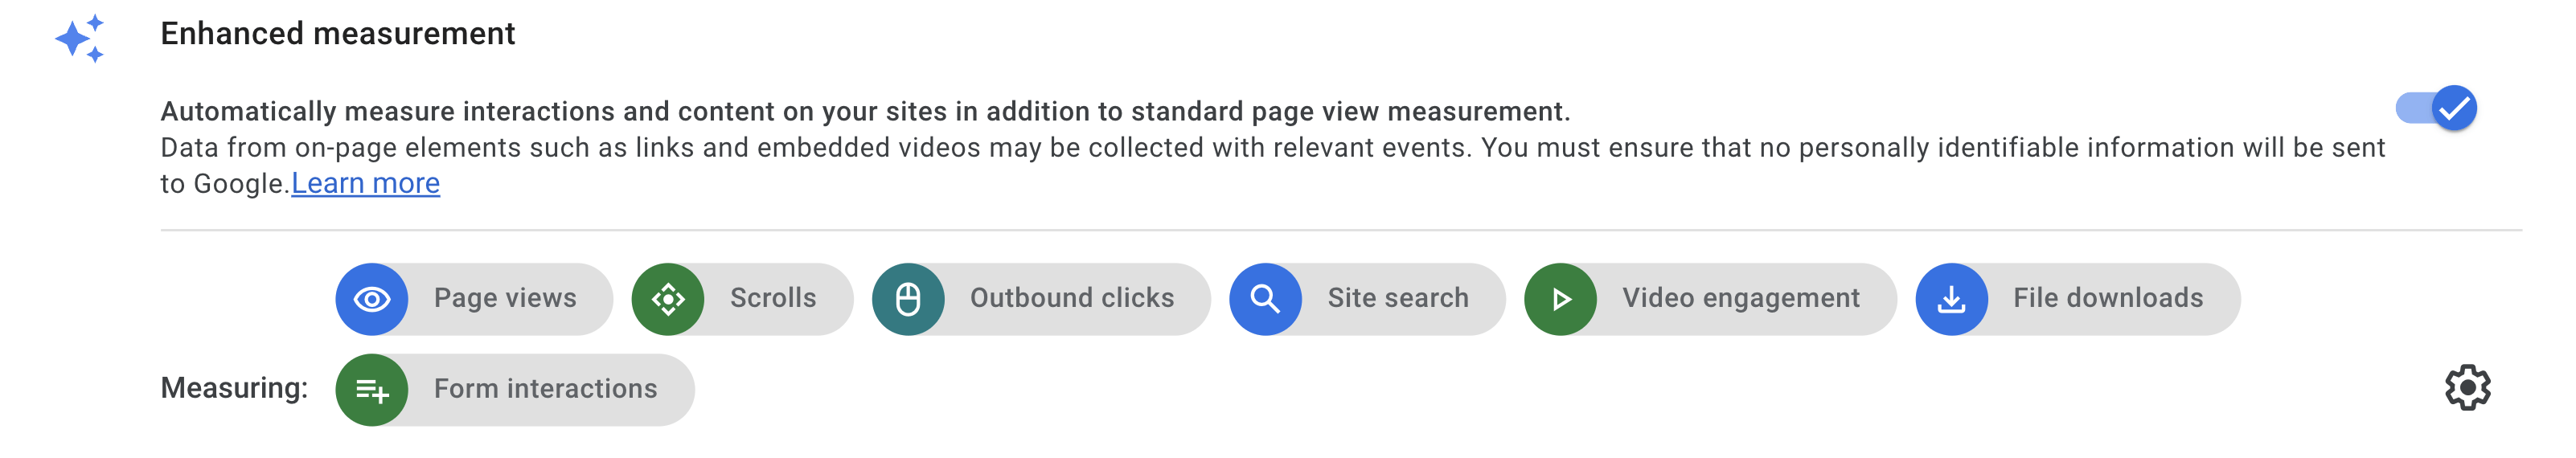
Step 4: Data Collection Methods
Start capturing user data using Google’s recommended methods:
Direct Tag Addition: Embed the Google tag directly into your web pages.
CMS Integration: Incorporate the tag through your Content Management System. We recommend the Site Kit Plugin, it’s the easiest way to integrate the tag and all your favourite Google tools, right from your WordPress dashboard.
Google Tag Manager: Use Google Tag Manager for advanced tag management and enterprise workflows. Watch the video below for a step-by-step tutorial on how to start GA4 tracking with Google Tag Manager.
Step 5: Testing, Testing, Testing
After implementing the tracking code, ensure everything is running smoothly. Make use of tools like Google Tag Assistant and GA4’s DebugView to troubleshoot and confirm the smooth collection of valuable data.
Got questions about migrating from UA or want to chat about your digital marketing strategy? We’re here to help! Just drop us a line.